# Appendix A - Historical Greenhouse Gas Emissions
# Greenhouse Gas Overview
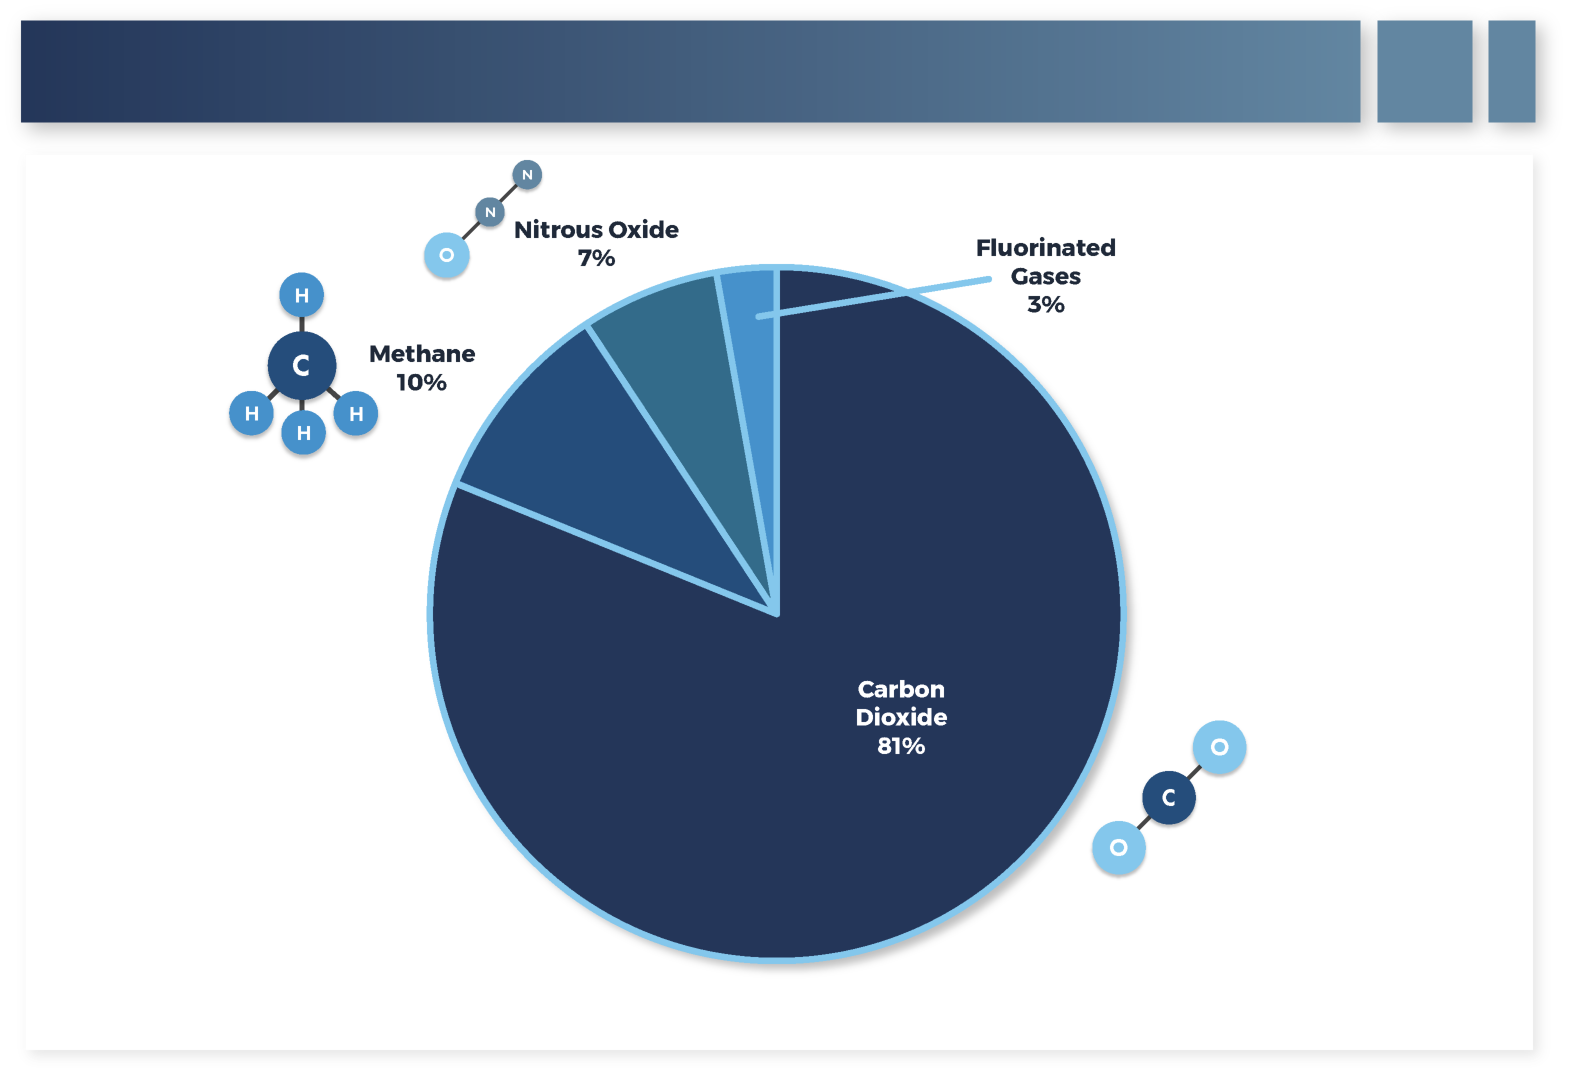
GHGs comprise a variety of gases that capture and trap some of the sun's energy that would otherwise be radiated from the surface of the Earth into space. Among man-made emissions, CO2 is the GHG that receives the most attention. Other important GHGs include CH4, nitrous oxide (N2O), and fluorinated gases, including sulfur hexafluoride (SF6) (EPA 2020). To create a simple metric that estimates the relative abilities of each of these gases to trap energy, scientists calculate their "global warming potential" (GWP) for a specific time period, typically baselined to the ability of CO2 to capture energy. This allows the warming impacts of all GHG emissions to be given in a measurement of CO2e. Table 4 gives the CO2e emissions for each of these gases while Figure 29 provides the contribution of each of these GHGs to total CO2e emissions from the U.S. in 2018 , the latest year for which data is available.
| Gas | GWP of gas (100-year) |
|---|---|
| CO2 | 1 |
| CH4 | 25 |
| N2O | 298 |
| Fluorinated Gases | 12,200 – 22,800 |
# Historical Greenhouse Gas Emissions
# Total GHG Emissions
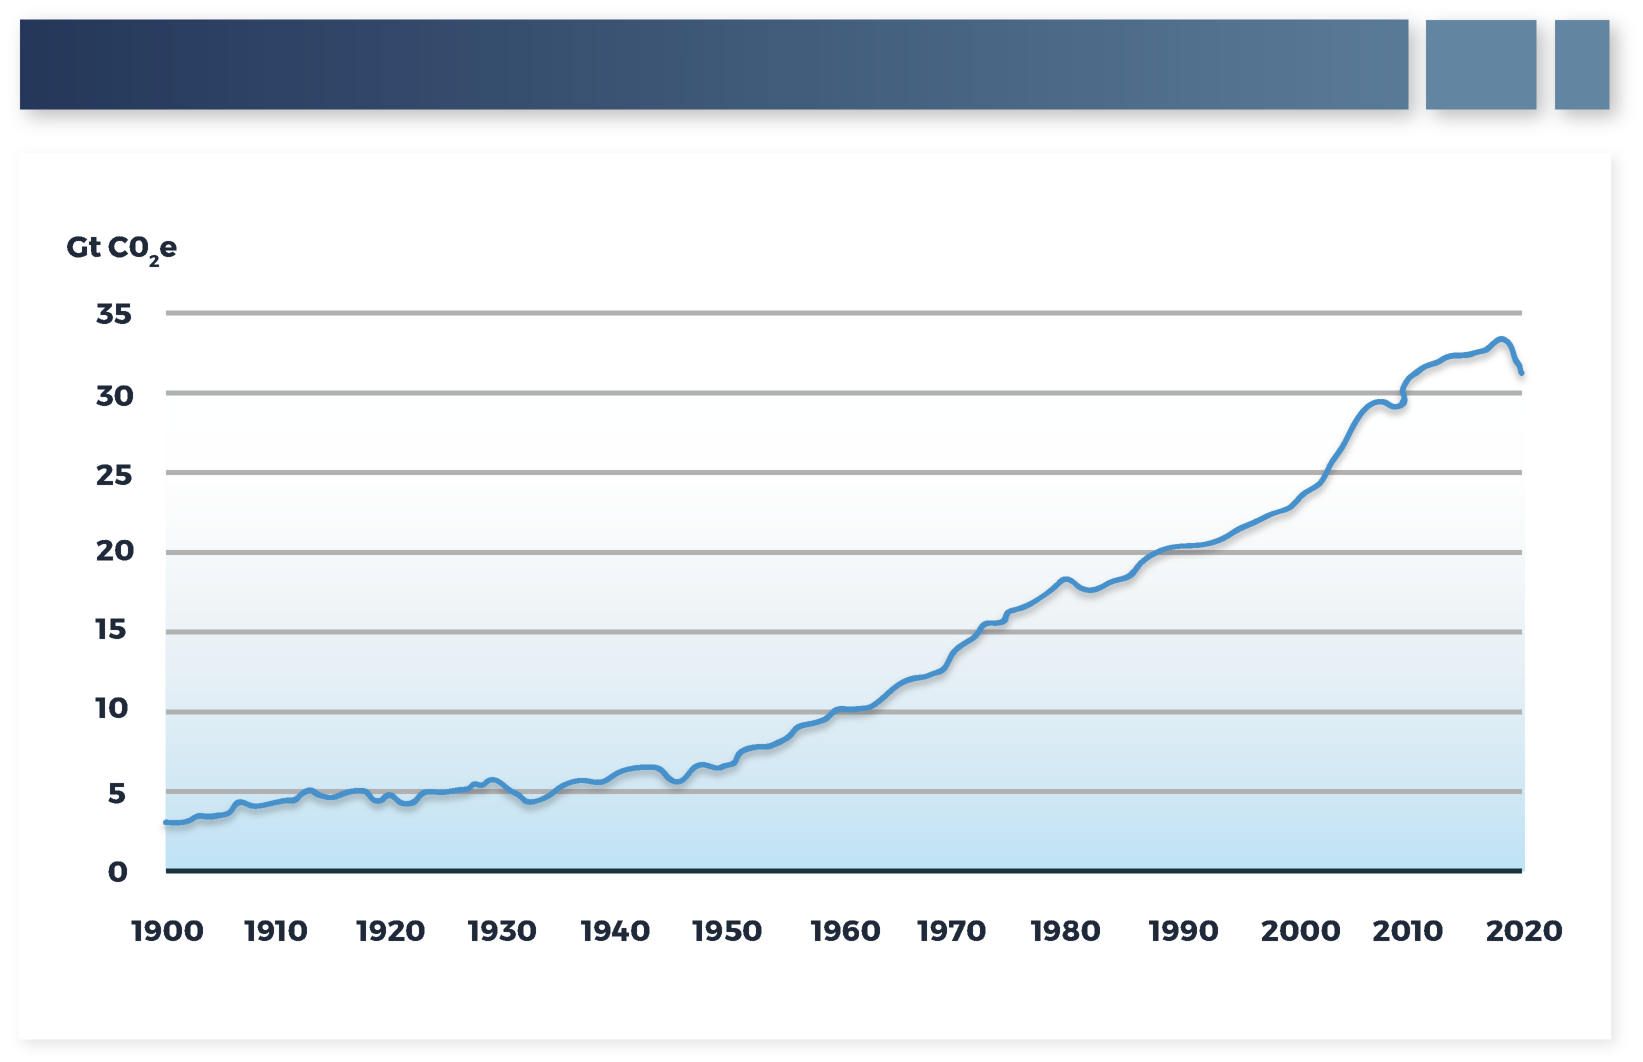
Annual global energy-related emissions of GHGs have generally increased since 1900, though these emissions only doubled from ~3 Gt CO2/yr to ~6Gt CO2/yr from 1900 until the end of World War II in 1945. Since 1945 annual energy-related emission growth has accelerated, primarily as a result of the build out of electricity grid and transportation infrastructure across around the globe and the subsequent increase in energy use this infrastructure enabled. By 2019, annual energy-related emissions temporarily peaked at ~34Gt CO2/yr before falling to an estimated ~31Gt CO2 in 2020, with this decrease being attributed to the COVID-19 pandemic—meaning that emissions are likely to rise again once the pandemic is over in the absence of broad-scale actions targeting changes in how energy is produced and used. Figure 30 shows global annual energy-related CO2 emissions from 1900 to 2020.
# Greenhouse Gas Emissions by Economic Sector
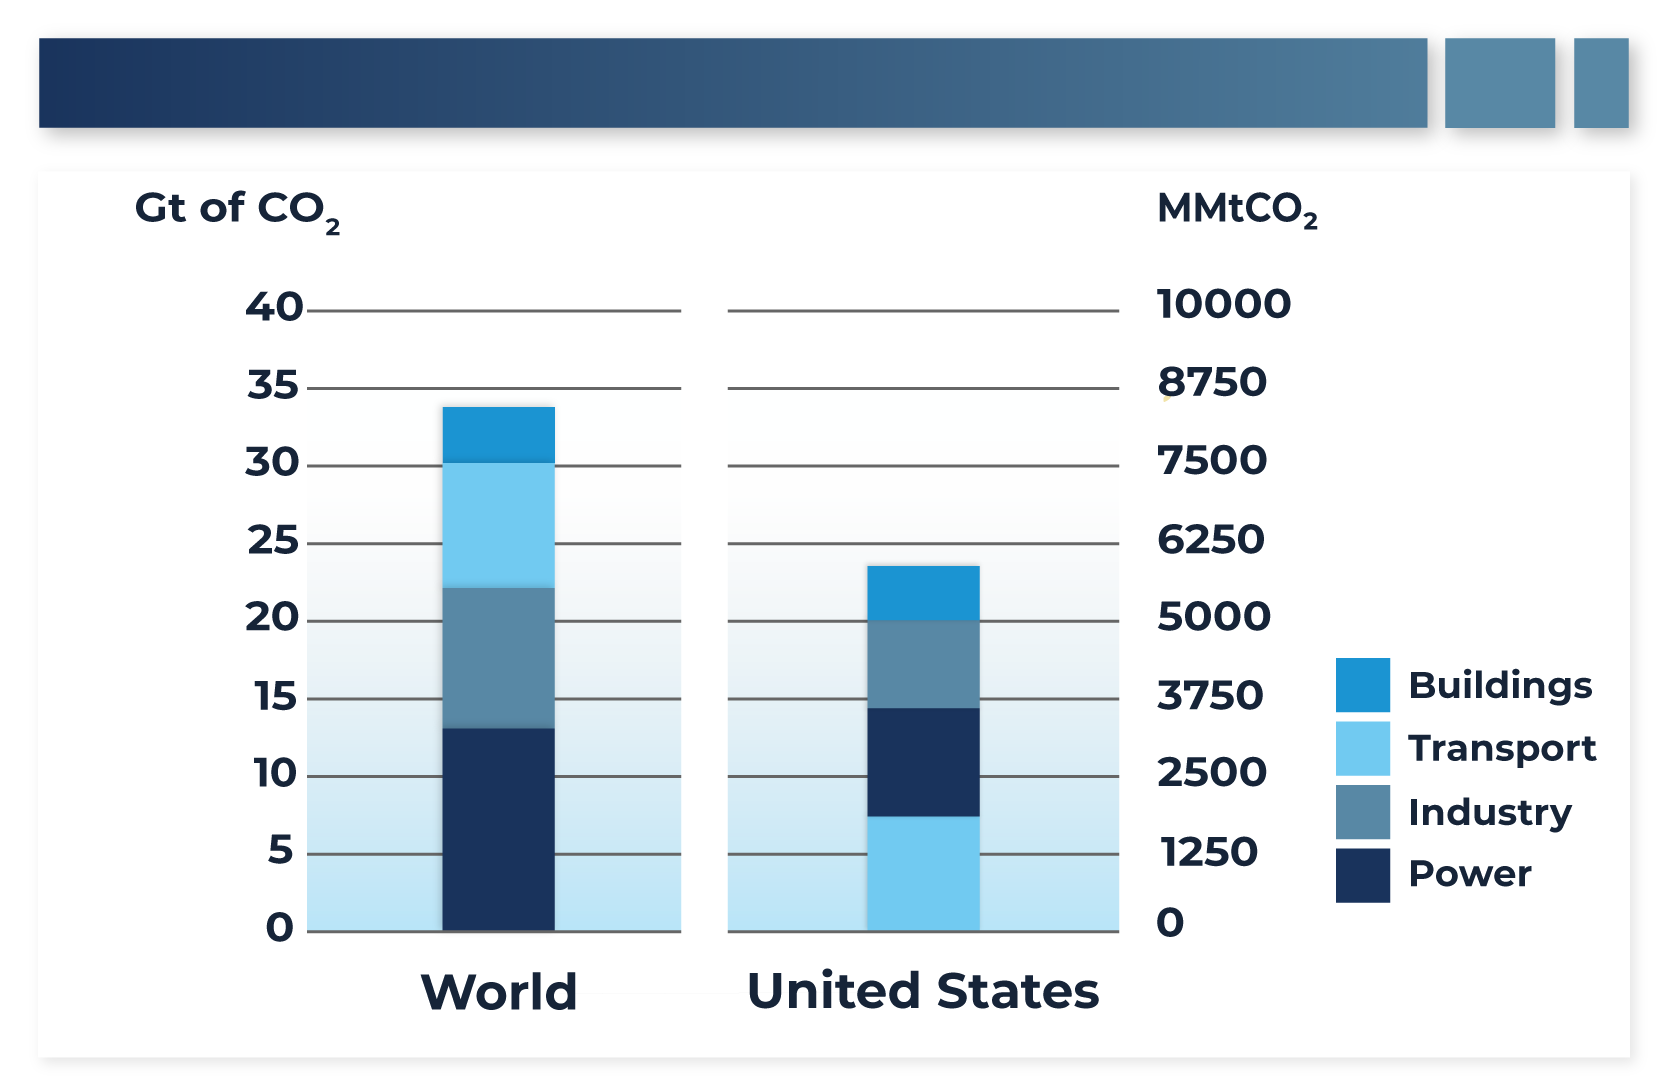
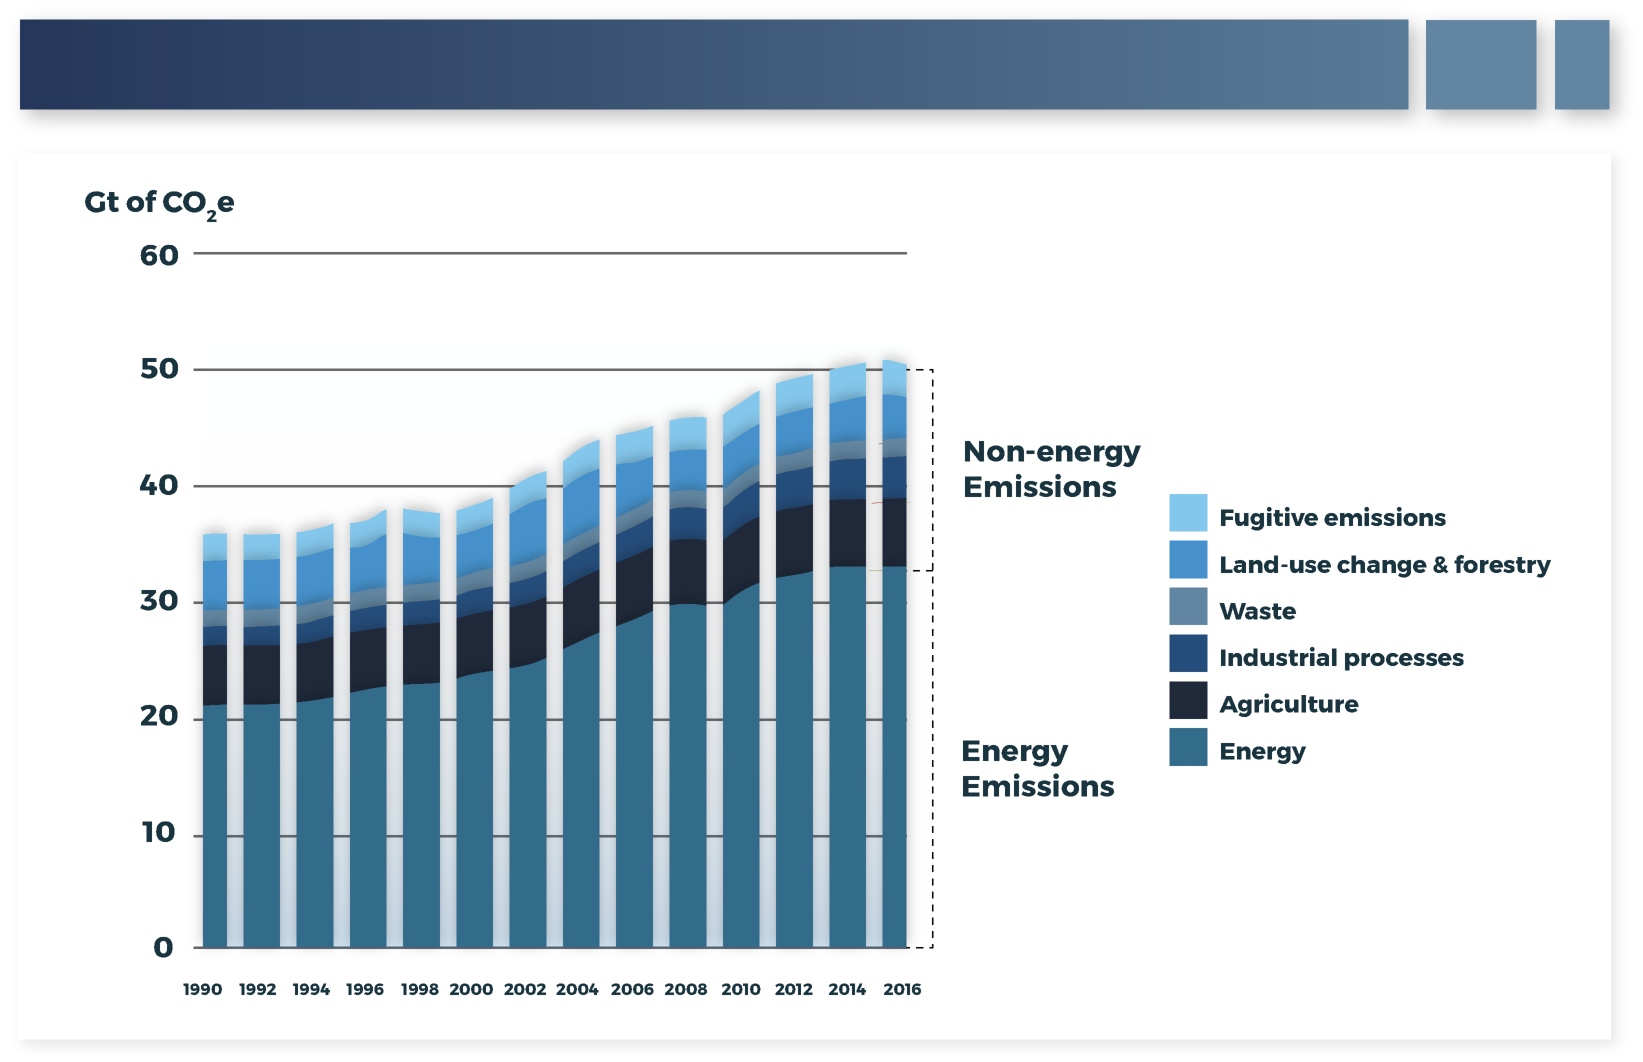
Over the past few decades, the electric power sector has been the leading source of energy-related GHG emissions, and it remains so today on a global basis, as shown in the left bar in Figure 31. However, in some regions, such as the U.S. and Western Europe, emissions from the power sector have been falling due to energy efficiency gains and a shift to cleaner sources of electricity. These transitions have resulted in the transportation sector becoming the largest source of energy related emissions in these areas—as shown for the U.S. in the right bar in Figure 31. However, energy related emissions only account for 60% of all human-caused emissions, as seen in Figure 32, with the other 40% coming from activities such as land use changes, agriculture (livestock), and chemical reactions in the formation of various industrial goods (for example, concrete).