# Why LCRI?
To address the challenges and gaps in achieving deep carbon reductions across the energy economy, the Electric Power Research Institute (EPRI) and GTI Energy have created the Low-Carbon Resources Initiative (LCRI). LCRI is focused on the value chain of alternative energy carriers (AECs) and low-carbon fuels—such as hydrogen, ammonia, biofuels (including renewable natural gas [RNG]), and synthetic fuels—and research, development, and demonstration (RD&D) to enable their production, storage, delivery, and use across the energy economy[1]. These energy carriers/fuels are needed to enable affordable pathways to economy-wide decarbonization by mid-century. This five-year, global collaborative will identify and accelerate fundamental development of promising technologies; demonstrate and assess the performance of key technologies and processes, identifying pathways to possible improvements; and inform key stakeholders and the public about technology options and potential pathways to a low-carbon future.
There is a growing momentum worldwide—led by countries, cities, and companies—to decarbonize all sectors of the economy and achieve net zero emissions (NZE)[2] around midcentury. As of October 2020, 826 cities, 103 regions, and 1,565 companies from around the world have pledged to achieve NZE. The number has roughly doubled since late 2019 (New Climate 2020). In September 2020, China—the world's largest polluter by gross weight of emissions—announced that it planned to become carbon neutral by 2060 (McGrath 2020). Following China's announcement, both Japan and South Korea announced that they want to achieve NZE by 2050 (PM of Japan 2020; Reuters 2020). Across the globe, the European Union announced a similar intention earlier in 2020 (European Commission 2020). In the U.S., the Biden Administration announced its intent to implement a similar target upon taking control of the government in 2021 (The White House 2021). In total, 127 countries responsible for an estimated 63% of emissions are now considering or have adopted net-zero goals (New Climate Institute and Climate Analytics 2020).
While these governments are setting these goals, many of the largest companies—representing a variety of sectors and located across the globe—have also made NZE commitments. Examples include electric and gas utilities; major oil producers, such as Total (Total 2020), Repsol (Repsol 2019), BP (BP 2020), and Shell (Shell 2021); large airline carriers such as British Airways, Iberia, Qantas, Japan Airlines, and Finnair (oneworld 2020); major technology companies including Apple (Apple 2020), Google (Google 2020), Facebook (Facebook 2021), and Microsoft (Microsoft 2020); and retailers such as Amazon (Amazon 2021), Walmart (Walmart 2020), and Ford (Ford 2020). While the timelines and details for achieving these goals vary widely across these companies, the diversity of the entities announcing these intentions demonstrates that many of the largest players in a variety of economic sectors see both a need and a value in transitioning to a NZE future.
LCRI Sponsor Statements
Click here to access LCRI sponsors' statements and commitments to decarbonization.
Despite these pledges, many of these entities—governments and companies alike—have yet to release detailed plans for how these goals would be achieved. Further, many of them explicitly state that they do not know how they will fully decarbonize after taking initial steps involving energy efficiency and renewable energy deployment. This is a tacit acknowledgement that achieving NZE by midcentury will be challenging and there is a need for additional research and development (R&D) focused on hard-to-decarbonize energy needs and economic sectors. Because there is considerable variance in the underlying economic, environmental, and sociological conditions for each entity, there is also a need for a diverse set of potential pathways to achieve NZE that will allow for each region, country, and/or company to choose from a variety of options.
This research vision combines the efforts of the LCRI's technical subcommittees (TSCs) to identify technology needs, characterize the current state of efforts underway, and identify remaining gaps to drive LCRI action and investments. The research vision is a living document and will be updated annually over this five-year effort based on learnings from the research under the LCRI as well as developments in the broader energy community.
# Vision for a Low-Carbon Energy Economy
Achieving net zero emissions across the economy by 2050 will require accelerating a safe, affordable, and reliable energy transition and advancing a variety of clean energy technologies and options.
EPRI and GTI have created LCRI to evaluate pathways for deployment of alternative energy carriers in support of decarbonization across the energy economy by mid-century.
The LCRI is focused on a vision of the future global energy system that is decarbonized, consumer-focused, sustainable, and resilient.
# Achieving Net Zero Emissions Across the Energy Economy
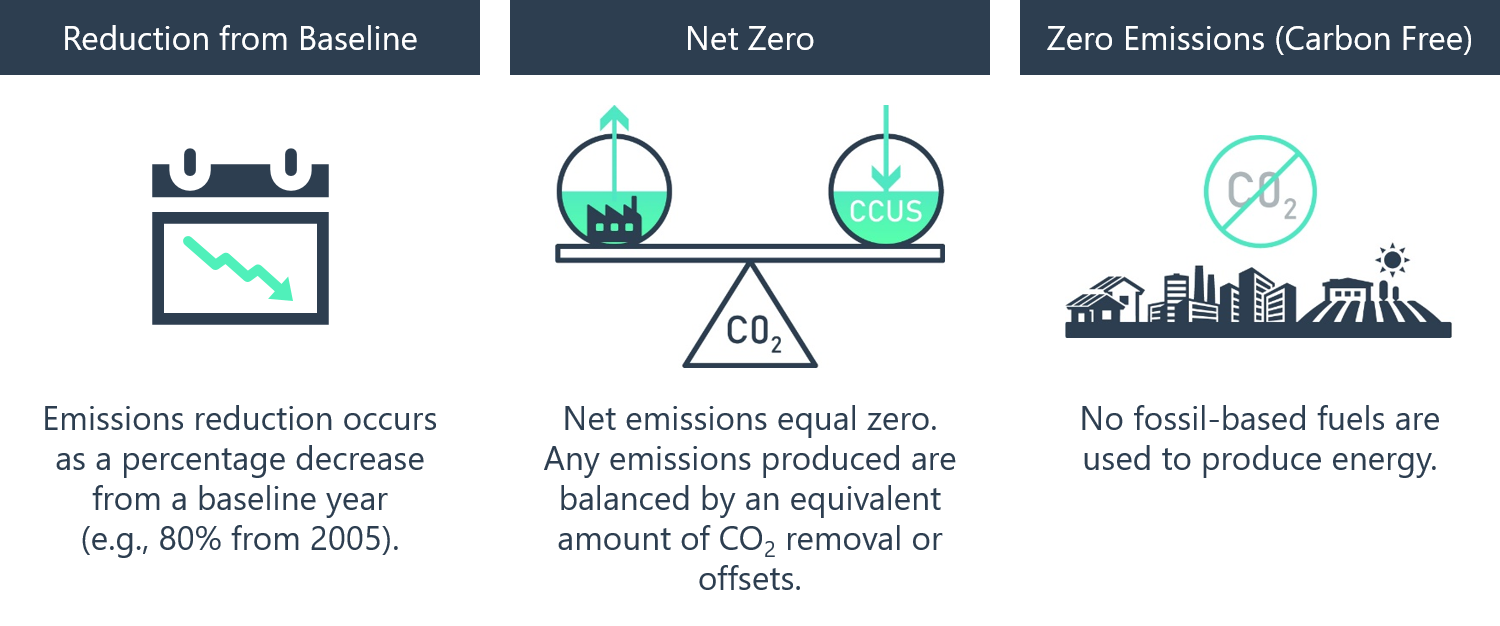
Defining an end state for lower emissions of carbon dioxide (CO2) and other greenhouse gases (GHGs)[3] is critical to establishing priorities for achieving future targets. Three conditions are commonly used to describe decarbonization, and it is important to distinguish and clarify the meaning and intent of each. These conditions are reduction from a baseline, net zero, and zero CO2 emissions. The LCRI is primarily focused on net zero scenarios.
Studies have identified many possible pathways for achieving energy-related NZE based on differing assumptions in the ways that humankind will use energy in the 21st century and available carbon-reduction technologies. These assumptions are themselves built on estimates of future population levels, trends in economic growth and income convergence, estimates of future energy demand, behavioral change, and technological progress. Further, individual countries or regions have varying access to clean energy resources and differing energy needs. Because of these challenges there is no single best strategy for reaching NZE. However, certain transformations likely apply to many pathways and regions.
# Transformation 1: Energy Efficiency
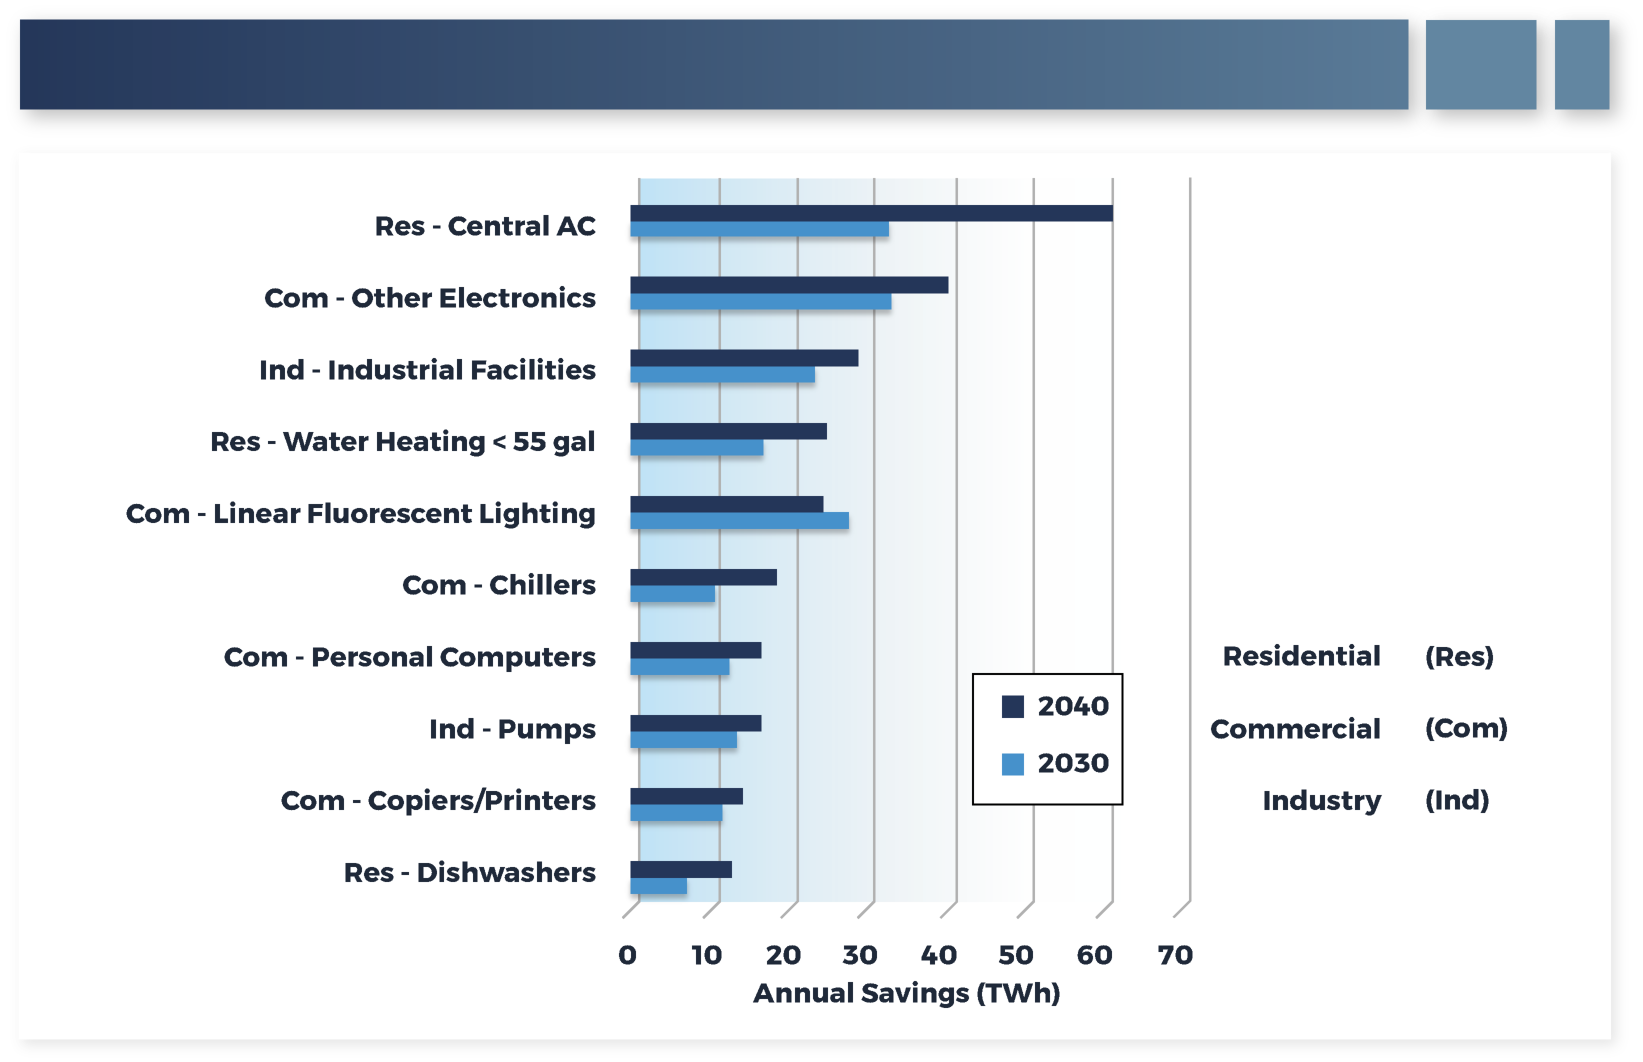
Most NZE scenarios incorporate greater energy efficiency across the economy. EPRI research refers to four waves of efficiency: government standards (for example, for appliance or vehicle efficiency), utility programs (aimed at overcoming barriers to achieve economic efficiency), technology spillovers from the rapid advances in consumer electronics, and intelligent/automation (EPRI 2019). Electric and gas utilities in developed regions of the world have demonstrated opportunities to enable energy efficiency as an emissions reduction pathway. Over the last two decades, electricity consumption has been reduced by more than 50 terawatt hours (TWh) in the U.S. alone relative to what it would be absent these efficiency measures. There is potential for hundreds more TWh of reduction over the coming decades, as shown in Figure 1.
Similarly, efforts to improve the efficiency of natural gas utilization have focused on aiding customers in increasing energy efficiency through building retrofits and advancement of new technologies with improved efficiency while decreasing natural gas leakage throughout the gas distribution system. It is estimated that through these efforts North American natural gas utilities saved 425 million therms, or 42.5 trillion Btu, with the equivalence of 2.25 million metric tonnes (MMt) of avoided CO2 emissions in 2018.
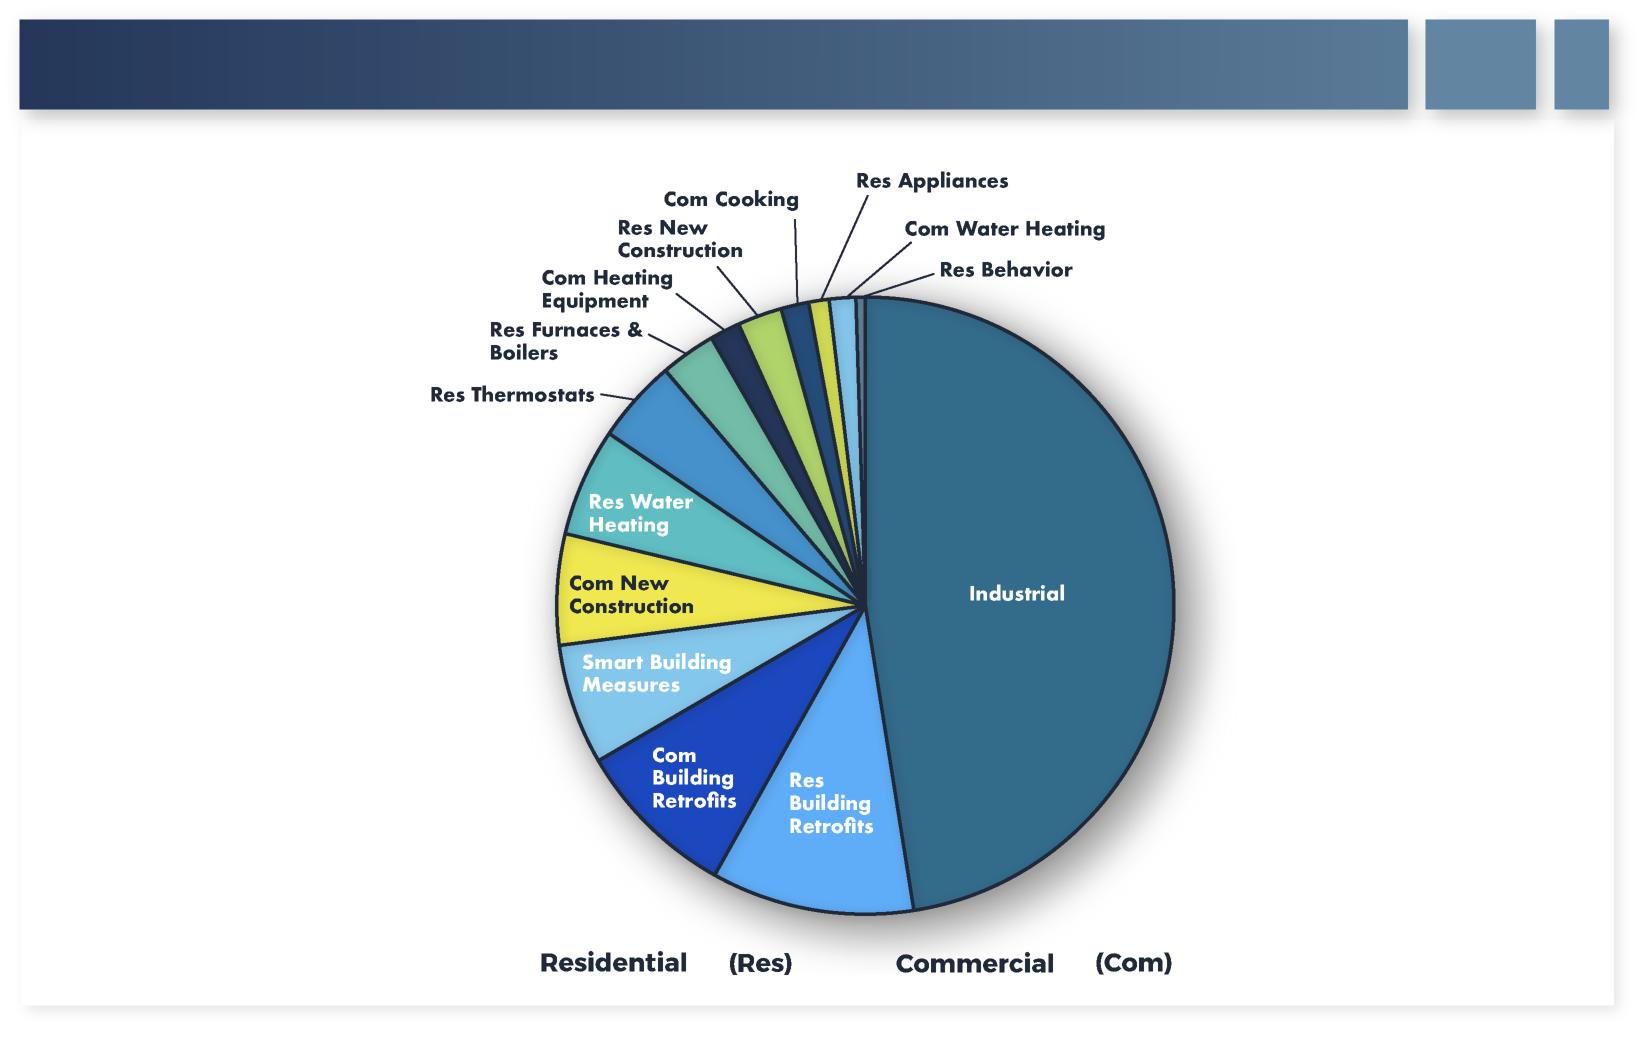
Across the natural gas sector, through 2030 it is estimated that the maximum technical saving potential from energy efficiency is approximately 26% below estimated demand absent efficiency efforts. This is the equivalent to improvements in efficiency of 2% per year. The sources of these potential savings are given in Figure 2 (ACEEE 2017). As is common with technical potential estimates, the likely realized savings will be less, but this does set an upper bound on what efficiency alone could accomplish.
# Transformation 2: Cleaner Energy Production and Delivery
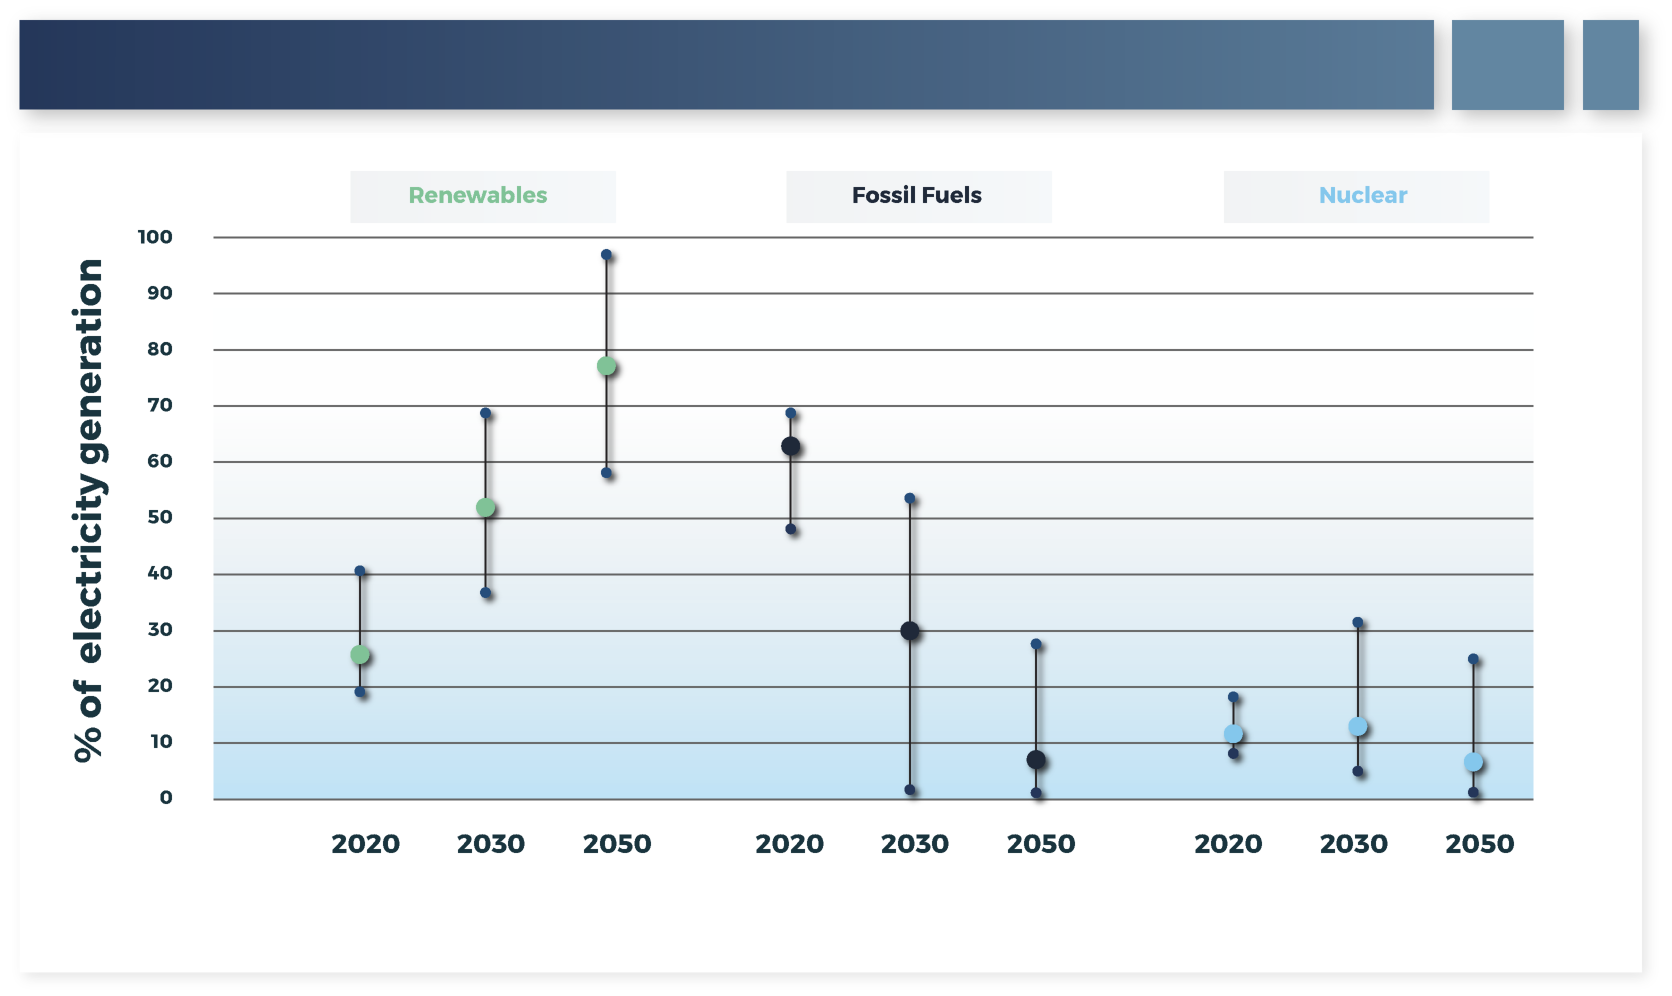
Increased deployment of clean energy electricity sources is already underway across the globe and is expected to grow as costs continue to decline. For example, Figure 3 shows the percentage of electricity, as a range with median values, anticipated to be generated by renewables (primarily wind, solar photovoltaics [PV], and hydropower) and from fossil fuels (primarily natural gas and coal) from a subset of scenarios in the Intergovernmental Panel on Climate Change (IPCC) Special Report Global Warming of 1.5°C (IPCC 2018). The scenarios from which these results were pulled are those with emission paths that are projected to limit global temperature rise to 1.5°C with no or low overshooting[4] of that target. In general, the results of these 40+ scenarios show a significant reduction in the use of fossil fuels and an increase in renewables, largely via growth in deployment of solar PV and wind, with nuclear generation largely remaining stable.
To accommodate a greater dependence on wind and solar generation, investments must be made to increase the capacity and flexibility of the electric infrastructure and address the inherent variability of power generation and loss of firm capacity and reliability services (for example, voltage regulation) currently supported by fossil assets. To provide this flexibility, most NZE scenarios project a large increase in the amount of storage on the electric grid. For example, as of 2019, the U.S. electric system had about 22 Gigawatts (GW) of pumped-hydro storage, 1 GW of battery storage, and 0.5 GW of various other energy storage technologies (EIA 2020b). However, over the next fifteen years it is projected that another 20 to more than 100 GW of 2- to 4-hour batteries will be constructed to provide short-term flexibility (EPRI 2021a). Low-carbon, firm capacity from nuclear power generation is also anticipated in many scenarios, highlighting both the value of operational license extensions for today's nuclear fleet and deployment of next-generation technologies in the coming decades. Finally, to provide an additional source of low-carbon firm capacity and flexibility, electricity produced from some combination of bioenergy, hydrogen, and/or natural gas with carbon capture and storage (CCS) may be needed to fill gaps during periods of high load or low-renewable-generation production.
Investments will also be needed to upgrade both the electric transmission and distribution systems. Transmission additions and upgrades will be needed to connect renewables and other clean resources and increasingly to broaden load balancing areas, employing geographic diversity to address variability as the renewable share of generation grows. Distribution investments will be needed to support the growth of personal vehicle and fleet charging, to enable effective utilization of distributed energy resources (such as rooftop PV and home batteries) and to expand options for demand-side flexibility, and to increase system awareness for reliability, resiliency, and rapid response to disruptions.
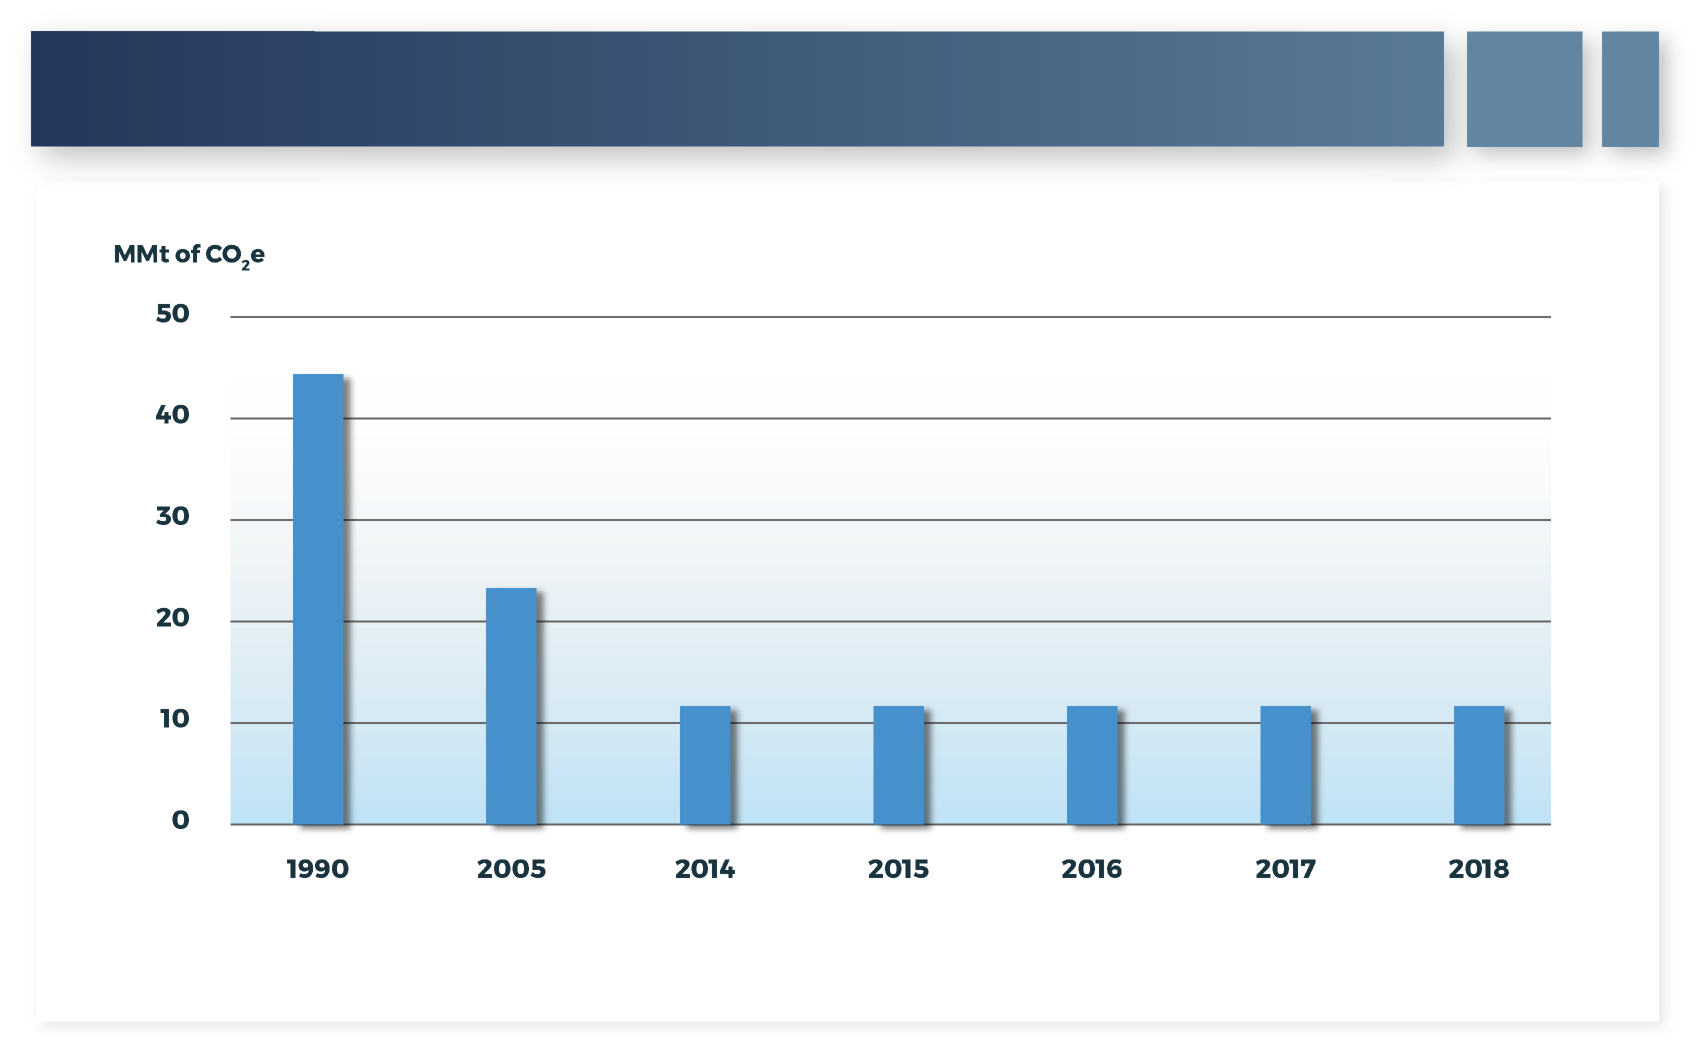
Improvements in emissions reduction are also being made in the production and delivery of natural gas. In 2018, total GHG emissions from natural gas systems (not including end-use combustion) in the U.S. were 174.9 MMt carbon dioxide equivalent (CO2e). Leakage of methane (CH4) to the atmosphere is the largest single component of these emissions (U.S. EPA 2020). Significant progress has already been made in reducing these emissions as a result of utility and pipeline system modernization, as shown in Figure 4, and further reductions in leakage remains a key piece in continuing to reduce GHG emissions from the natural gas energy supply in the near term. To this end, several U.S. local distribution utilities (LDCs), who are largely responsible for the delivery of natural gas from producers to end users, have already announced CH4 reduction targets.
Approaches that LDCs have taken, and are continuing to take, to reduce CH4 emissions include:
Modernization of infrastructure, as older infrastructure (equipment and pipelines) tends to have higher leakage rates.
Implementation of enhanced leak detection and repair with targeted and more frequent pipeline leak surveying and adoption of leak detection technologies including enhanced imaging (for example, thermal cameras) and increasingly sensitive detection devices to discover unknown leaks.
Improvement of operational practices, including adoption of best practices such as capture of the gas released during pipeline blowdowns and implementation of programs to reduce pipeline damages ("dig ins") caused by contractors and homeowners.
Capture of gas emissions from packings, seals, vents, and other locations and reinjection of the captured gas into the gas system.
Adoption of gas procurement standards where LDCs can look upstream and source natural gas that is produced, processed, and transported with lower CH4 emissions profiles.
# Transformation 3: Efficient Electrification
The decarbonization of electricity generation is generally a necessary prior step in emission reduction strategies that rely on significant electrification, though there are applications in which electrification can reduce emissions without further grid decarbonization. Examples of early applications of electrification include (examples and forecasts below from IEA 2020c):
Electric passenger cars have lower emissions than comparable cars with internal combustion engines even when powered by fossil-based electricity. Emissions can be eliminated altogether when powered by clean energy.[5] Based on ownership economics, driving patterns, car ownership trends, and falling EV prices, more than half of the new passenger cars sold globally in 2030 are projected to be electric—up from about 2% in 2020.
In the residential sector, it is projected that over 100 million households globally will be heated with electric heat pumps rather than natural gas or oil in 2030.
The use of heat pumps to produce low temperature heat in industry is up to five-times more efficient than conventional boilers. Globally, it is projected that roughly one-third of industrial low temperature heat (<100 °C) is electrified by 2030 using electric heat pumps.
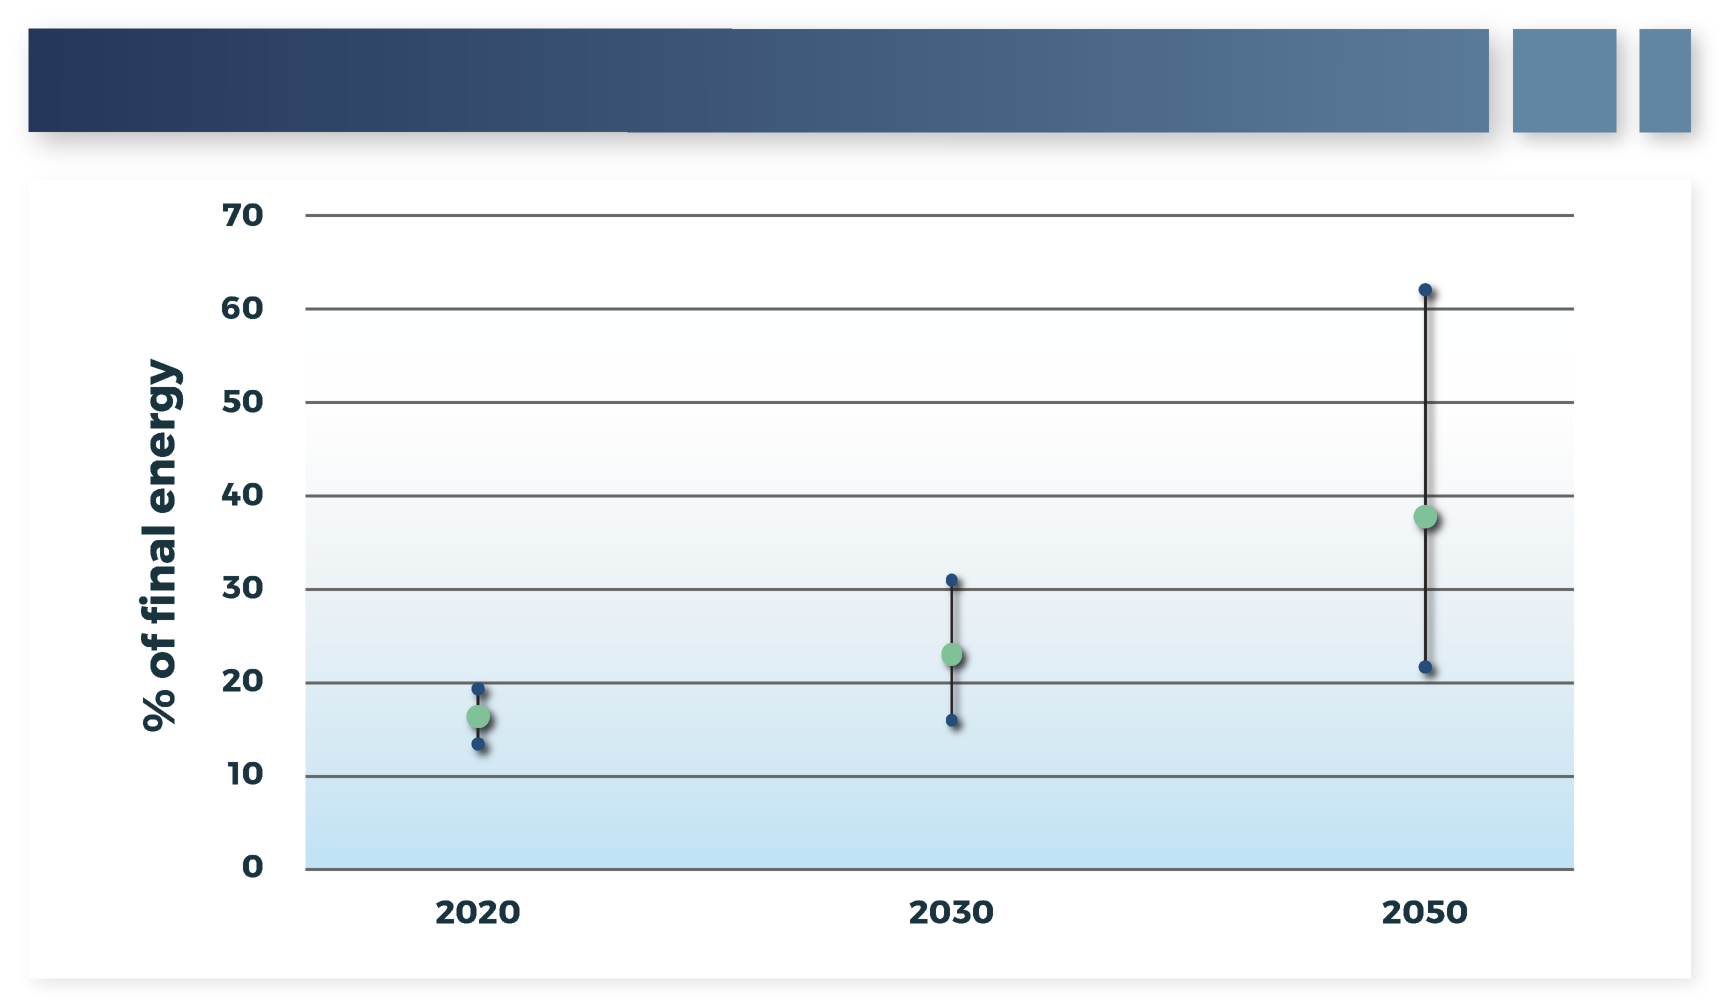
Most NZE scenarios forecast a significant increase in electricity's share of final energy consumption. Figure 5 shows projections of electricity final energy share globally, as a range with median values, from 2020 to 2050 for the IPCC Special Report Global Warming of 1.5°C scenarios meeting the 1.5°C with no or low overshoot target (IPCC 2018). As shown in the figure, each scenario envisions electricity's share growing, with the median scenario projecting nearly 40% of final energy being delivered by electricity to achieve NZE.
# Transformation 4: Deep Carbon Reductions
The first three transformations represent a general agreement that the easiest and most cost-effective steps to begin GHG emissions reduction is to replace electricity generation from coal, and later natural gas, with renewables and other low-carbon energy sources in the electricity sector while implementing energy efficiency and electrification in other sectors of the economy where possible. However, each of these approaches becomes increasingly more difficult as they progress; energy must still be used, the intermittency of renewable resources makes ensuring energy reliability increasingly expensive at high penetrations, and there are many applications in the transportation and industrial sectors that are prohibitively expensive to electrify or, in some cases, cannot be electrified at all.
# Alternative Energy Carriers
There is a need for solutions that can address hard-to-decarbonize sectors and achieve deep carbon reductions in others. AECs[6] such as hydrogen, ammonia, biofuels, and synthetic fuels could service these needs. By definition, AECs are not sources of energy; rather, they are molecules created from the conversion of other energy sources to more easily transport and/or store energy. These AECs can generally be created from electricity generated from low- or no-carbon resources, from fossil fuels with CCS, or from biological resources that allow the resulting carrier to be low-carbon or carbon neutral. Examples of these AECs, their status of development, and their potential uses include the following:
Hydrogen already has a market of over 70 MMt annually, though most of this existing market represents industrial purposes rather than use as an energy carrier. Currently, over 99% of hydrogen production comes from fossil sources without carbon capture, resulting in 830MMt of emissions annually (IEA 2019b). However, hydrogen itself emits no carbon when used, can be stored for long periods, and can be transported long distances—three attractive attributes in a low-carbon future. There has been considerable research into clean hydrogen production from either electrolysis or fossil fuels with CCS, and there now exist some early commercial deployments using hydrogen as an energy carrier, such as fuel cell passenger cars and forklifts. However, technology advances are still needed in production and transportation, while end-use application must expand beyond current markets to enable scaling and reduction in cost. In addition, hydrogen serves as a necessary feedstock for other potential AECs, such as ammonia, synthetic natural gas (SNG), or other synthetic fuels, which could be created from clean hydrogen at an additional cost and with additional energy losses in the conversion process, but with benefits—such as easing fuel delivery and use—that could outweigh the additional production costs for certain applications.
Biofuels are the most widely used AEC today. Ethanol is the best-known biofuel and has been blended into the automobile fuel supply since the 1980s and 40% of corn acreage in the U.S. today is used to supply this fuel. RNG is also a prominent biofuel that is widely used. Most RNG today is produced by collecting and treating the gases released from the decomposition of organic matter at non-hazardous landfills, dairy or swine farms, wastewater treatment plants, and food waste processing facilities, though RNG can also be produced from dedicated production facilities. Biofuels offer a path to develop so-called drop-in fuels that could avoid challenges in converting some difficult to modify applications over to new fuels, such as military aviation. When evaluating biofuel options, there is a need to evaluate emissions resulting from the production of the fuel and potential societal trade-offs (e.g., food and forest product implications). As with all decarbonization strategies, there is a need to balance achieving climate and other social goals.
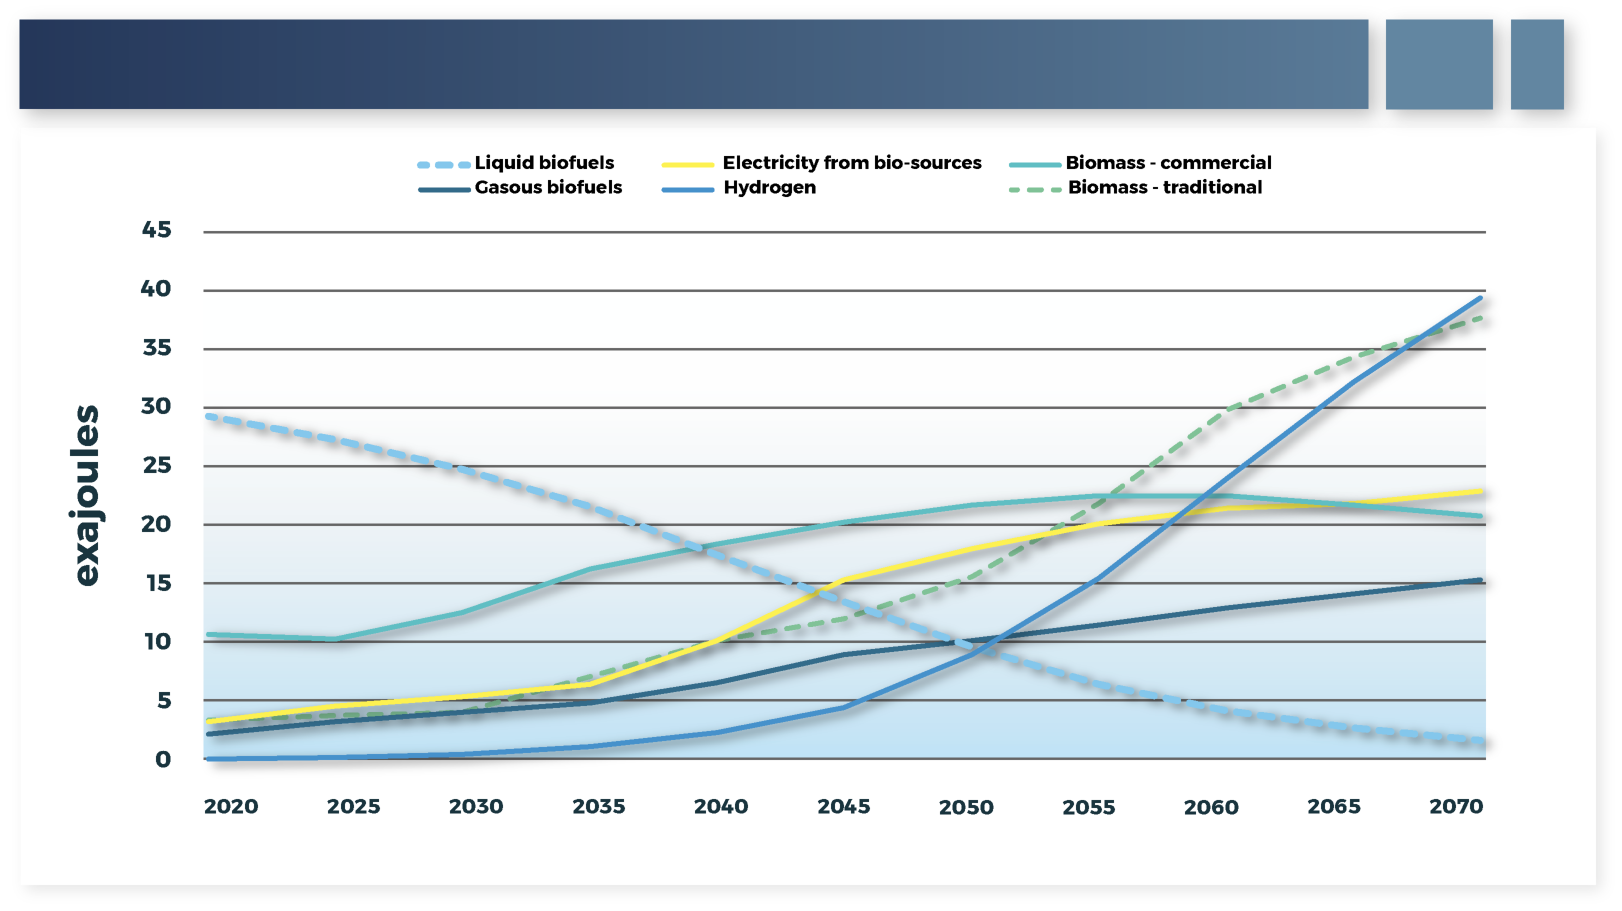
Most NZE scenarios portray a significant role for hydrogen and biofuels. Figure 6 shows the projected final energy amount globally delivered by hydrogen and various biosources over time from the Shell Sky scenario (Shell 2018).[7] As shown in the figure, use of hydrogen grows substantially alongside new biosources, while "traditional" biomass is expected to fall largely due to the anticipated electrification of the passenger transport sector. The anticipated future uses of these AECs offers the potential to utilize existing infrastructure, either because it is the same molecule (for example, SNG, RNG) or the existing infrastructure can be converted for AEC use (for example, natural gas networks with hydrogen blending or fully converted for pure hydrogen use, conversion of natural gas turbines to use hydrogen or ammonia as fuel). This existing infrastructure utilization could ultimately reduce the cost and accelerate the timeframe of NZE achievement. However, significant research is still needed on material interactions, safety and operations, and combustion characteristics for the conversion of this existing infrastructure over to AEC use.
# Carbon Negative Technologies
Although AECs are a potential solution to many of the hard-to-decarbonize sectors of the economy, there may still be some energy applications that cannot be economically decarbonized. Further, there are non-energy emissions from human activity, primarily in the agriculture sector,[8] that may have no decarbonization solution. Therefore, carbon negative technologies, such as direct air capture (DAC) or bioenergy with carbon capture and storage (BECCS), may be necessary to completely decarbonize the economy.
CCS plays an important role in many NZE scenarios based on the various roles that it can fill to limit fossil fuel emissions from electricity generation and industrial applications along with its capability to remove CO2 from the atmosphere when combined with bioenergy or DAC. Over the next 30 years, the emphasis of CCS may shift between these roles. In the near term, the focus of CCS will be primarily on reducing emissions from existing fossil-fired electricity generation plants and industrial processes. Over time, however, the emphasis of CCS may shift from capturing emissions from the use of fossil fuels to use in BECCS or DAC[9]. As an example of the importance that CCS may play in achieving NZE, across the IPCC 1.5°C pathways with no or limited overshoot, the cumulative CO2 stored through 2050 ranges from zero to 300 Gigatonnes (Gt) CO2 with zero up to 140 Gt CO2 from biomass captured and stored (IPCC 2018).
Since 2017, plans for more than 30 new integrated carbon capture, utilization, and storage (CCUS)[10] facilities have been announced. The vast majority are in the U.S. and Europe, but projects are also planned in Australia, China, Korea, the Middle East, and New Zealand. If all these projects were to proceed, the amount of global CO2 capture capacity would more than triple, to around 130 MMt/year (IEA 2020b). DAC and BECCS use CCS processes similar to fossil fuel combustion CCS, though modifications to the specific carbon capture material may be required, meaning that learnings from these plants can ultimately be applied to DAC and BECCS. In addition, though they are still largely considered emerging technologies, BECCS and DAC are being deployed today. There are currently several BECCS facilities operating around the world and more than 10 DAC plants operating or under construction in Europe, the U.S., and Canada. However, there are still significant research needs in identifying appropriate carbon capture technologies specific to these differing applications (due to the differing concentration of CO2 in their intake), in scaling these technologies and reducing cost broadly, and in carbon valorization efforts that would provide additional value to these technologies and offset some of their cost.
# The Net Zero Emissions Future
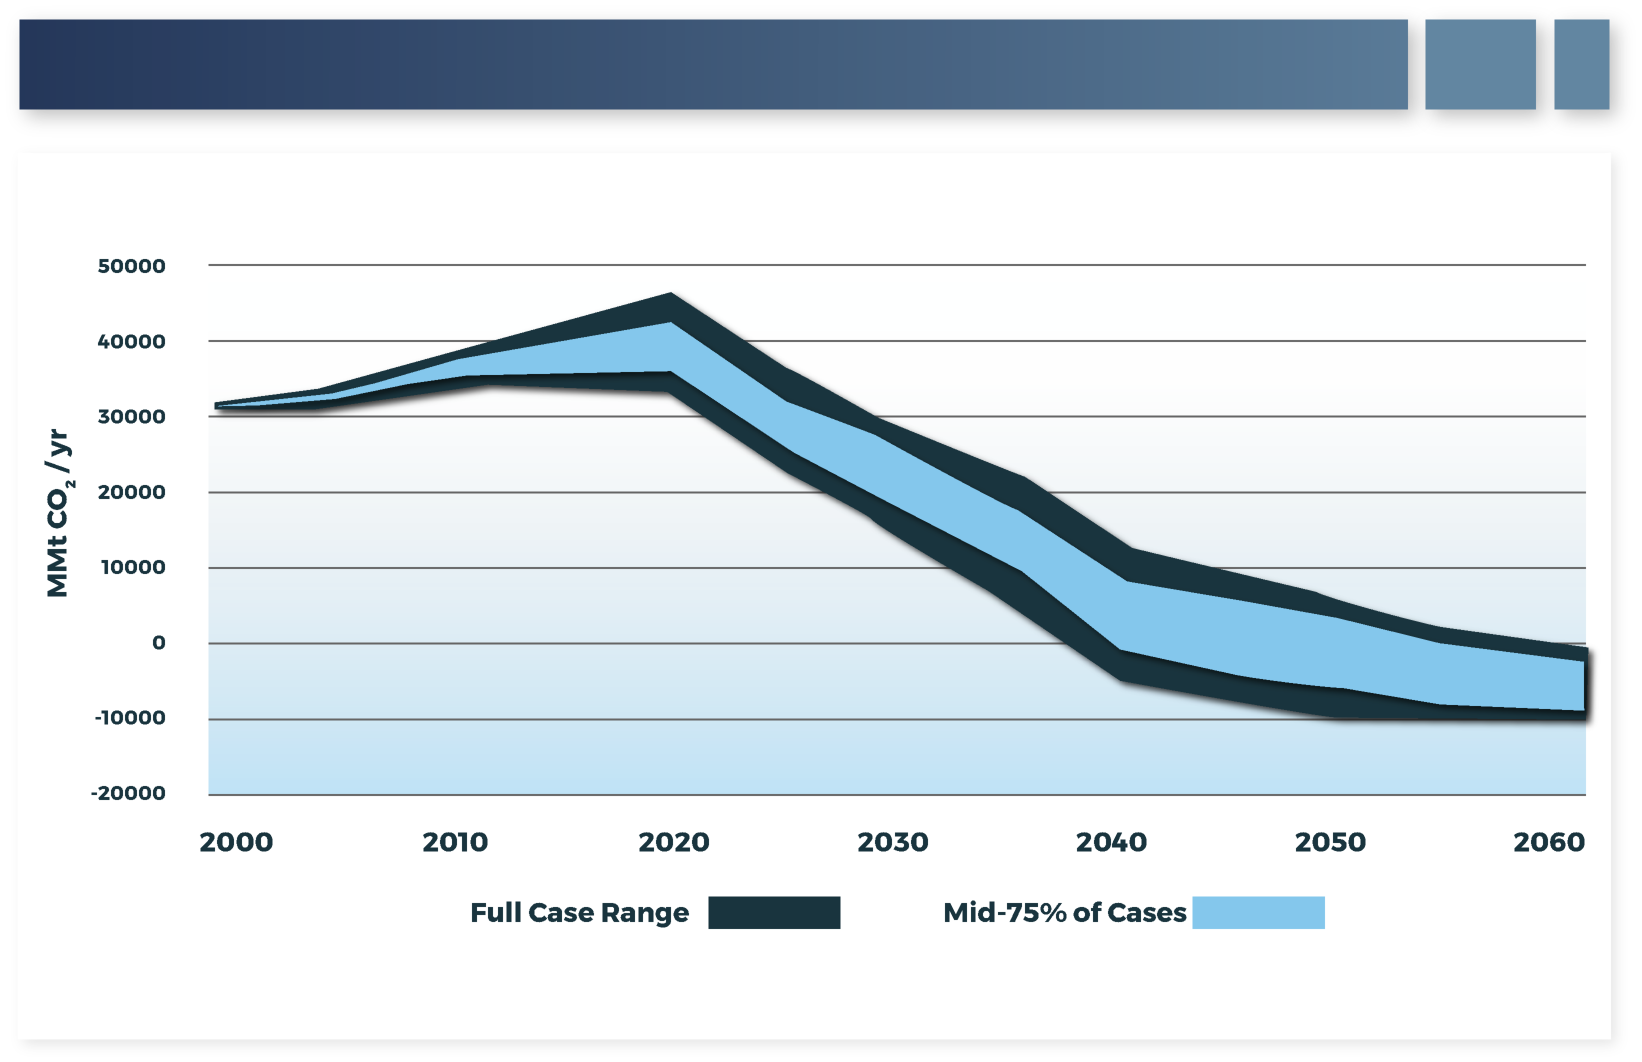
Although there are some common themes in the approaches to achieve NZE, a variety of pathways will be needed to enable economy-wide decarbonization. One way to visualize this variance is to examine multiple emissions projections by models as portrayed in the IPCC Special Report Global Warming of 1.5°C (IPCC 2018). These emission paths are projected to limit global temperature rise to 1.5°C with low or no overshoot of that target. The range of annual emissions under these scenarios are shown in Figure 7. The variety of cases achieving NZE in these scenarios furthers the point that it is not yet clear precisely how NZE will be achieved, but there are several potential methods for achievement.
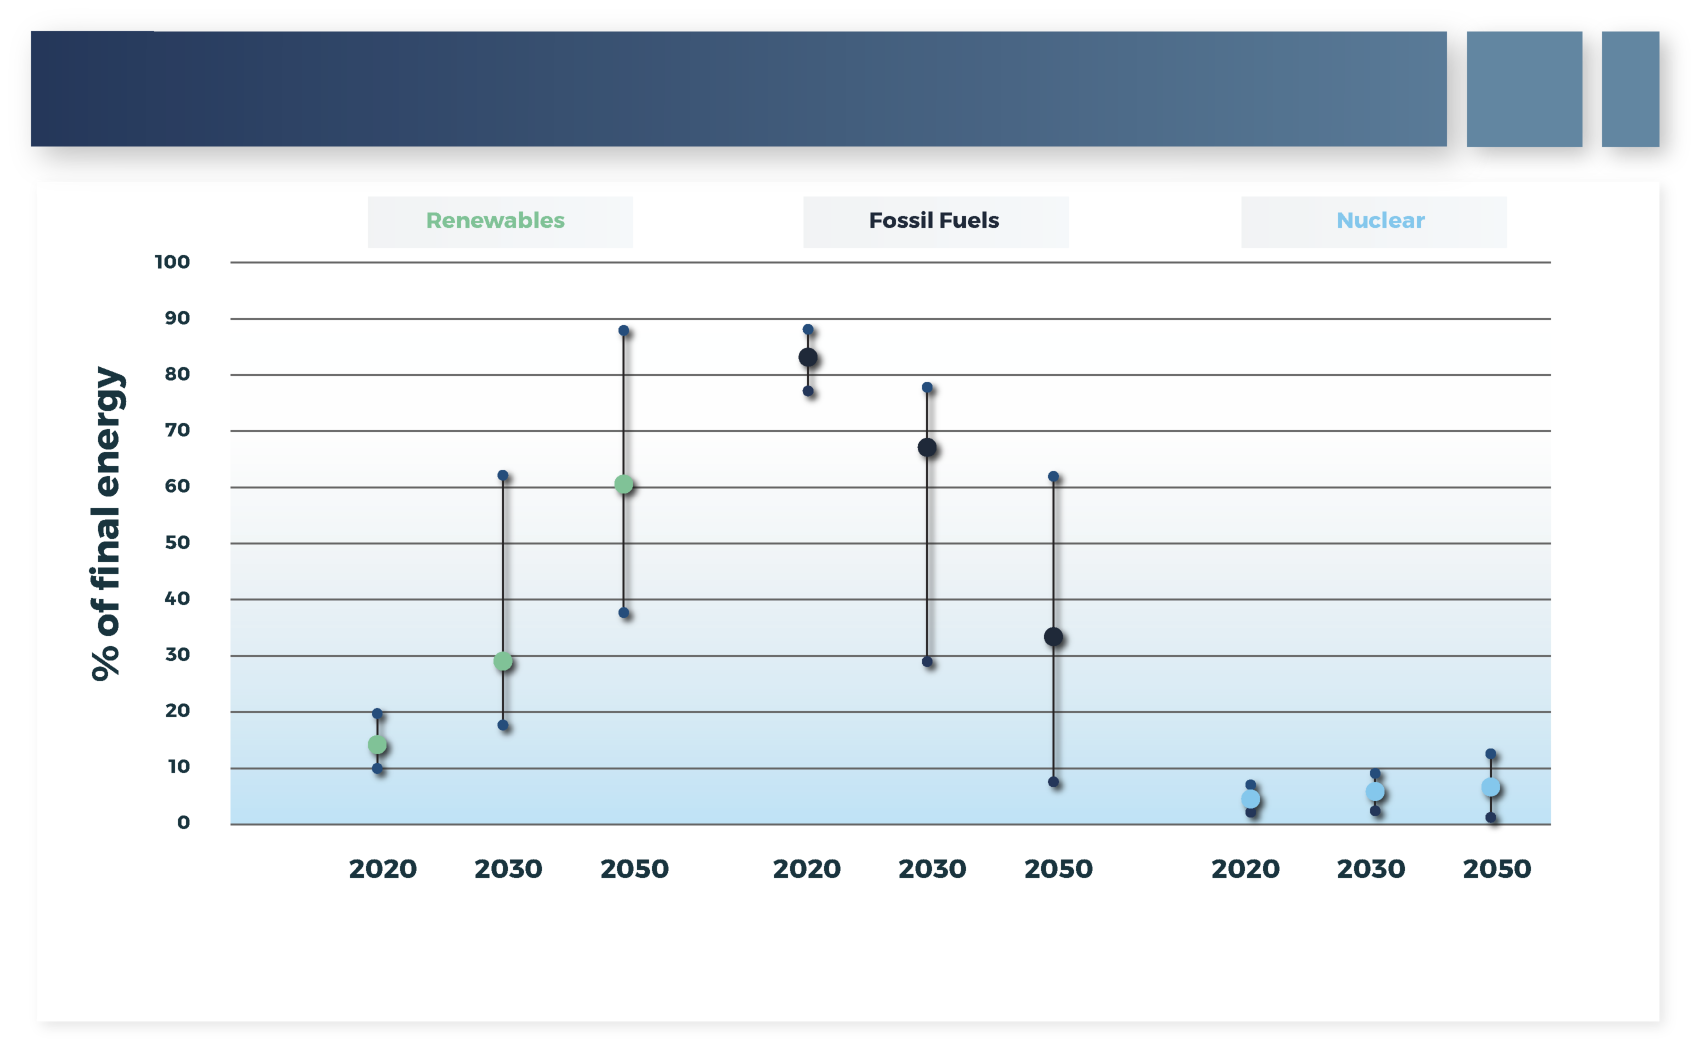
Although the pathways to achieve NZE may be uncertain and various, it is clear that the achievement of NZE will transform the energy sector. Similar to trends seen for electricity generation, renewable energy's share of final energy is expected to grow substantially in a NZE future while the use of fossil fuels declines. Figure 8 shows expected final energy fuel sources, as a range with median values, from the 40+ IPCC 1.5°C scenarios with low or no overshoot (IPCC 2018). The remaining smaller share of fossil energy is enabled only through CCS and the deployment of carbon negative technology.
These projected NZE energy mixes can only be realized if the performance and costs for AEC, CCS, and carbon negative technologies are reduced to a level that societies find palatable. This is not a given and will require a significant effort to bring these needed technologies to a state where they can provide the energy services and reliability that consumers demand. The remainder of this document highlights what makes an application hard to decarbonize and lays out the challenges and research needed to achieve the cost and performance targets in time to allow regions, nations, and companies to meet their NZE commitments.
Additional information on low-carbon AECs can be found in the EPRI Report An Introduction to Low-Carbon Fuels, Product Number 3002020041 (opens new window). ↩︎
In this document, the word emissions is defined as the release of greenhouse gases, excluding water vapor. For more background on greenhouse gases, see Appendix A. ↩︎
Although reducing CO2 emissions is central to the LCRI vision, other GHGs and environmental aspects are being considered. A further discussion on GHGs in included in Appendix A. ↩︎
Overshoot refers to allowing emissions to exceed those that correspond with the targeted warming amount (in this case 1.5°C). This would mean that warming would temporarily exceed that target, but the target would ultimately be achieved by later removing CO2 from the atmosphere. ↩︎
This latter statement regarding eliminating emissions refers to emissions from the car being driven. There may still be emissions related to the manufacture of the car. ↩︎
Also often referred to as low-carbon fuels. ↩︎
Note that the Shell Sky scenario is a NZE scenario but does not achieve NZE until 2070. ↩︎
See Appendix A of this document for further discussion. ↩︎
Utilization of CO2 for various applications is often seen as an important enabler of CO2 capture technology. ↩︎
CCUS is CCS with utilization of CO2, in some manner, incorporated. ↩︎